
KPI dashboards leadership opens every morning
Dashboards and scheduled reports built on agreed KPI definitions and trusted data.
What you get with BI Dashboards & Reporting
- KPI definitions
- Dashboard design
- Scheduled reports
- Role-based views
- Alerts
Phases, timelines and what you receive
Discover
Source inventory, KPI definitions, data model
Build
Pipelines, warehouse and first dashboards
Model
Forecasts, ML models and alerts
Operate
Monitoring, new sources and reports
Get a plan for BI Dashboards & Reporting
A few fields, no sales script. We reply within 1 business day with next steps.
Where we've done this before
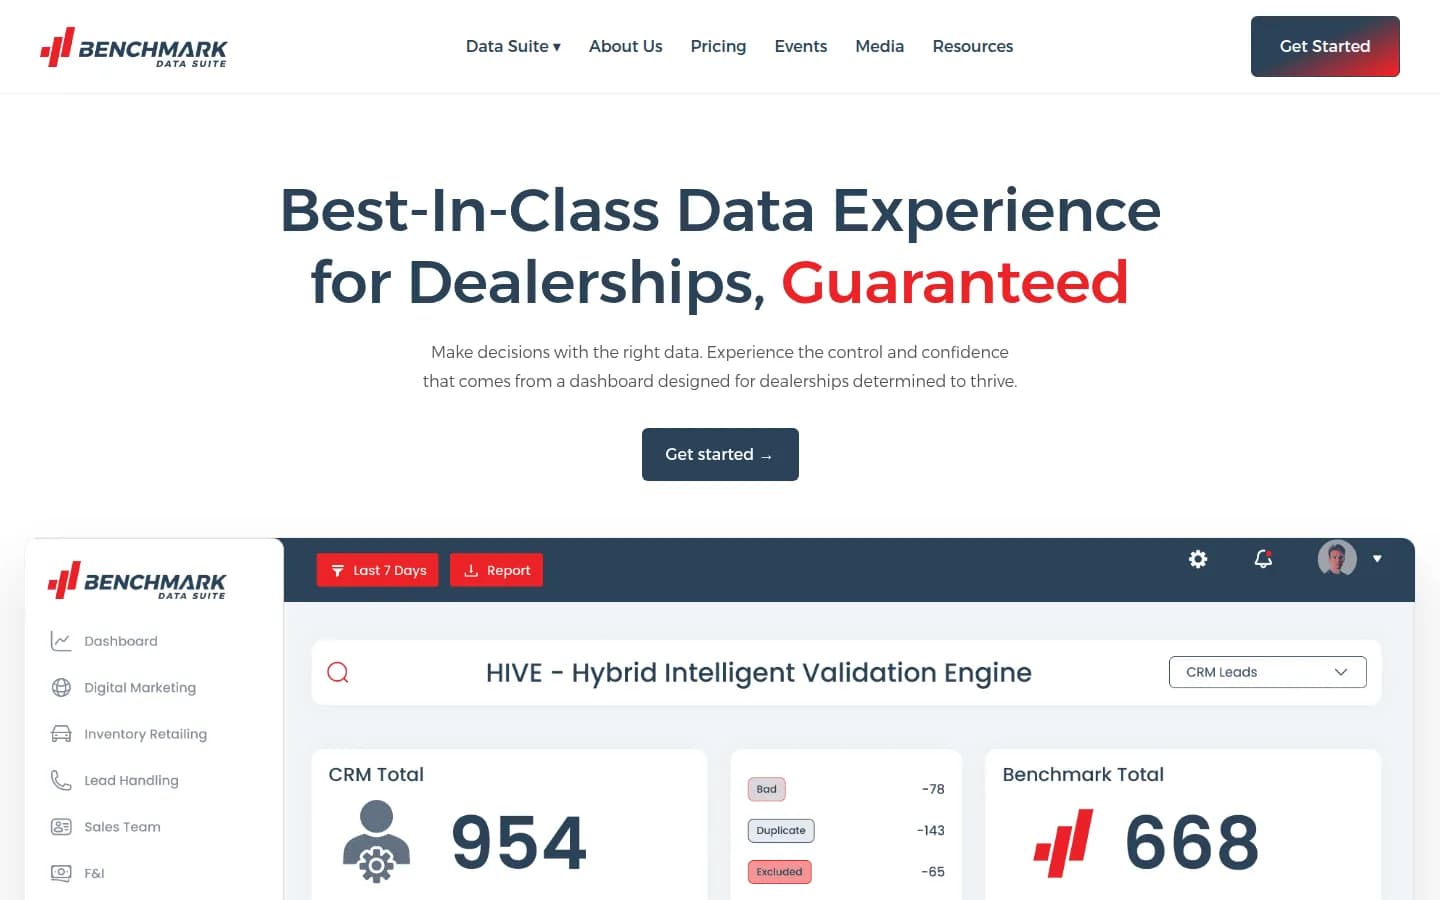

Real-time dealer KPIs
A dealership analytics platform turning DMS, inventory and CRM data into real-time KPIs


3,000+ dealers served
Warranty benchmark analytics that show dealers where warranty money is left on the table
What we build with
Ways to work with us
Every project gets a written quote after a short scoping call.
Fixed-scope project
Clear scope and timeline. Scope agreed before code starts; change requests quoted separately.
Dedicated team / AI Pod
Evolving roadmap or AI systems in production. Monthly, scale up or down with notice.
Support & maintenance retainer
Live products that need fixes, updates, monitoring and small features each month.
Frequently asked questions
Straight answers on cost, timelines, ownership and data.
Yes. Role- and location-based views are standard.
Ready to talk about BI Dashboards & Reporting?
Book a short call with a senior engineer. No pitch deck, just a clear next step.
- We reply within 1 business day.
- NDA available on request
- You own all code from day one